What is scientific (decoupled) molding, and what should a buyer ask a molder for to see a process is under control?
Scientific molding builds a molding process from measurements of the plastic, not trial and error. Its core is decoupling: the screw fills most of the cavity under speed control, switches over at a set position, then packs and holds on pressure. To check it, ask for the studies behind each setting, a plastic-side process sheet and per-cavity capability.
Scientific molding means setting a molding process from measurements of what the plastic is doing, not from whatever settings made a good part last time. Logan Teut, a trainer with RJG writing in Plastics Technology, draws the line this way: scientific molding is learning the principles, and systematic molding is applying them by a fixed method. In practice that means splitting the shot into stages, running a set of studies on the mold, and writing the process down in the plastic's terms: temperature, flow rate, pressure and cooling.
The target is viscosity. Teut calls the change in material viscosity the molder's biggest processing variable, one that can flip a process from short shots to flash. For a buyer, the value is evidence: a molder working this way can show numbers for why each setting is where it is.
What decoupling actually separates
A shot has three jobs: fill the cavity, pack in more plastic as it shrinks, and hold pressure until the gate freezes so nothing flows back out. Teut compares traditional molding to driving into a garage at one speed all the way to the back wall; stopping in the same spot every time is luck. Decoupling gives each job its own control.
- Decoupled II (the common form). Fill is separated from pack and hold. Per Teut, the first stage fills the part to at least 95% visually full and no more than 98% full by weight, under velocity control, and the switch to second stage happens at a screw position the molder adjusts until the fill-only part comes out right. Second stage then packs and holds on pressure. John Bozzelli runs his viscosity-curve shots about 99% full by volume. Either way, the first stage is a deliberate short shot.
- Decoupled III. Pack and hold are separated too, generally by switching on a cavity pressure reading instead of screw position. Teut notes it takes extra training, equipment and software.
Why stop short? Under velocity control the press pushes at the set speed and uses whatever pressure that takes, so fill time holds when the resin runs a little stiffer. Fill time sets shear rate and shear rate sets viscosity, which is why Bozzelli warns that a fill time that varies from shot to shot or press to press is effectively a different process. The condition is that the press never runs out of pressure during fill; he lists running pressure-limited among the main causes of uneven filling.
Decoupling also makes defects easier to trace. Teut diagnoses with fill-only parts, second stage switched off. Splay, jetting and burns that show on those parts belong to the fill stage; warp, voids, bubbles and sink marks more often trace to pack and hold. That stops the habit of chasing a fill problem with pack pressure.
The standard studies, and what each one should hand you
Teut starts with the press: injection-speed linearity, check-ring repeatability, load sensitivity and pressure response. If a mold may run on several presses, he builds the process on the least capable one so it transfers to the others. Then come the mold studies, each of which should produce a specific record.
Viscosity curve (rheology study)
Bozzelli's method: hold pressure off, a high injection speed, transfer set for a short shot about 99% full by volume, then lower the speed step by step and change nothing else, recording fill time and injection pressure at transfer each time. John Beaumont gives the working formulas: relative viscosity is plastic pressure times fill time, and relative shear rate is one over fill time. On a hydraulic press, the hydraulic reading is first multiplied by the intensification ratio. The curve falls steeply at slow speeds and flattens at fast ones, and the plastic is most stable on the flat section. In Bozzelli's example the viscosity at the fastest speed, a 0.39-second fill, was about 2,000 psi-s, and slowing injection raised it tenfold, a swing he says temperature and lot changes cannot come close to.
The flat section isn't always right. Bozzelli notes that optical lenses may need the steep section because fast fills leave too much birefringence, and parts to be painted or plated may need slow fills. The test also has a serious critic. Beaumont, whose team ran rheology tests on more than 40 production molds of one to 32 cavities, concluded that it can't isolate what happens inside the cavity and that picking a point on the curve is close to arbitrary; the choice can move if the test runs to 5 seconds instead of 20.
Worked example: a relative viscosity curve you can check
A hypothetical single-cavity ABS cover runs on a hydraulic press whose intensification ratio for the fitted screw is 10:1. With hold off and transfer set short, injection speed is stepped down and each shot's fill time and hydraulic pressure at transfer are logged:
| Fill time (s) | Hydraulic at transfer (psi) | Plastic pressure (psi) | Relative shear rate (1/s) | Relative viscosity (psi-s) |
|---|---|---|---|---|
| 3.00 | 530 | 5,300 | 0.33 | 15,900 |
| 2.00 | 520 | 5,200 | 0.50 | 10,400 |
| 1.50 | 540 | 5,400 | 0.67 | 8,100 |
| 1.10 | 600 | 6,000 | 0.91 | 6,600 |
| 0.85 | 670 | 6,700 | 1.18 | 5,695 |
| 0.65 | 790 | 7,900 | 1.54 | 5,135 |
| 0.50 | 940 | 9,400 | 2.00 | 4,700 |
| 0.40 | 1,100 | 11,000 | 2.50 | 4,400 |
Going from a 3.00 s fill to 2.00 s cuts relative viscosity by (15,900 - 10,400) / 15,900 = 35%. At the fast end the curve is flat: 0.65 s to 0.50 s drops it 8.5%, and the last step, 0.50 s to 0.40 s, gains only (4,700 - 4,400) / 4,700 = 6.4% while plastic pressure at transfer climbs from 9,400 to 11,000 psi, 17% more. So 0.50 s is a sound pick: on the flat part, without paying heavily in pressure for little gain.
Two more checks. Headroom: if the press can deliver 2,000 psi hydraulic, that's 20,000 psi plastic, and 9,400 / 20,000 = 47% is used at transfer, so fill won't go pressure-limited. Method: Beaumont lists four selection rules in use, from "the point right after the knee" to "the farthest point out." His fourth, half of 5% of the RV range added to the lowest RV, gives ((15,900 - 4,400) x 0.05) / 2 + 4,400 = 4,687.5 psi-s, between the 0.50 s and 0.40 s rows, while "right after the knee" points nearer 0.85 to 1.10 s. Different rules, different answers, which is why the process sheet should record the fill time, its tolerance and the reason. In Bozzelli's example the stable band was plus or minus 0.04 s.
Cavity balance study
On a multi-cavity mold, fill-only shots are kept by cavity and weighed; Teut adds a dynamic version that repeats the check at several speeds. The output is a table of fill-only weights. Four cavities at 5.62, 5.48, 5.71 and 5.40 g average 5.5525 g with a 0.31 g range, a spread of 0.31 / 5.5525 = 5.6%. If a slower speed gives 4.95, 4.70, 5.10 and 4.62 g, the spread is 0.48 / 4.8425 = 9.9%, so balance depends on speed and the fill-time choice has to account for it.
Imbalance can't be processed away. Bozzelli explains that at switchover the full cavity's plastic has nearly stopped and gone stiff while the short cavity's is still flowing, so pack pressure reaches the short cavity better; raise it and that cavity flashes while the other stays sinky. More clamp or parting-line rework doesn't help. His usual causes include gates of different land length, which a pin gauge won't catch, unequal flow paths, and the shear imbalance branching runners create even in a geometrically balanced layout, which commonly makes inner cavities fill first. See gate types.
Pressure-drop study
A short part has zero plastic pressure at the end of flow, so the transfer pressure of a short shot is the total pressure lost along the flow path. Bozzelli moves the transfer position to make a shot that ends just past the gate, then one that fills only the sprue and runner, and compares them. In his four-cavity polycarbonate example, 2,040 psi hydraulic at transfer with the part 96% full was 29,988 psi plastic at a 14.7:1 ratio: about 2,400 psi lost in the nozzle, 12,036 psi in the sprue and runner, about 3,000 psi in the gate and about 12,000 psi in the part. The runner was the target, but he warns that simply enlarging it lowers shear, which raises viscosity and wastes resin; a mold flow analysis finds the compromise. The output is a bar chart of loss per segment against the press maximum.
Gate-seal study
Hold time is stepped up with total cycle time held constant, parts are weighed, and weight is plotted against hold time; on a cold runner it climbs and then levels off at the gate-seal time. Bozzelli notes hot runners change the curve and valve gates can do anything. The basic steps are on the mold trial page. The step buyers miss comes next: he molds one set with the gate sealed and one unsealed and puts both through the product's performance tests across its use temperatures, because they can fail on opposite sides. If unsealed wins, he starts hold at about half the gate-seal time. Ask whether that decision was tested, not just for the plateau graph.
Cooling study
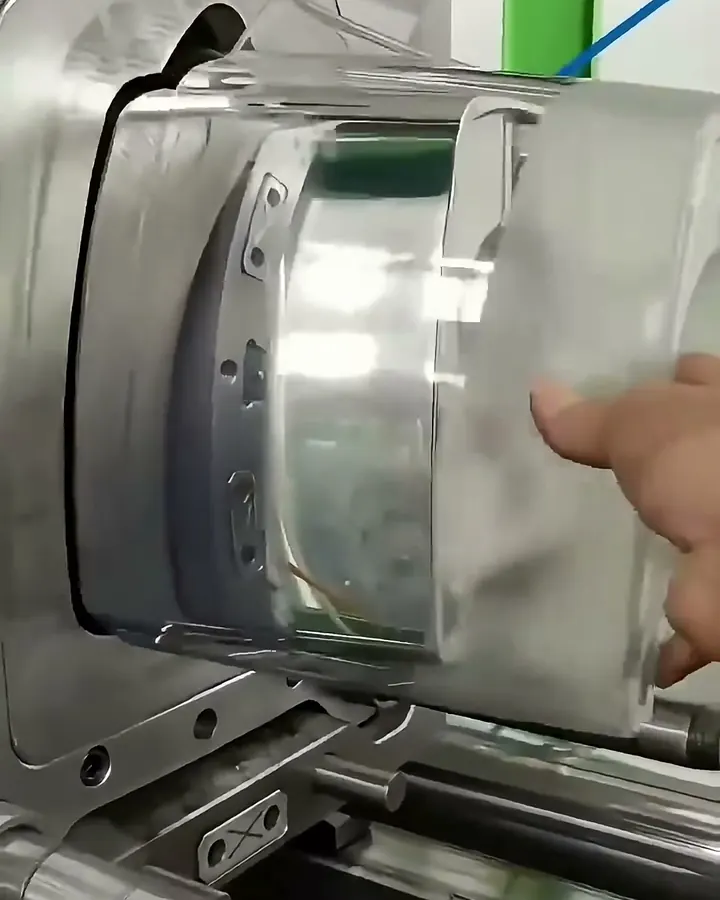
Teut puts cooling at around 80% of cycle time and calls it the most overlooked variable; he recommends flow meters on the circuits and mold surface temperature checks, ideally both. The usual output plots a critical dimension or warp against cooling time, with surface temperatures for both halves. Kulkarni adds a caution: the more a part is held by cores, the less cooling time affects its shrinkage, so a part with many holes may show a flat line. See mold cooling.
Process window and DOE
Suhas Kulkarni of Fimmtech, author of Robust Process Development and Scientific Molding, works in two phases. First he explores the 11 key machine parameters, 13 when pack and hold are separate, for the range that gives cosmetically good parts, ignoring dimensions: the cosmetic process window. Then a designed experiment on three to five of the most influential maps dimensions inside it. In his example, parts short below 4,000 psi plastic pack pressure and flashed above 9,000 psi give a 5,000 psi cosmetic window; if dimensions are met from 5,500 to 6,500 psi, that band is the dimensional window. If they're met only at 4,100 psi, the process is at the edge of a cliff, and the fix is steel or the specification. In his DOE series, pack pressure is almost always the most influential factor on dimensions, with melt temperature the usual second factor for amorphous resins, mold temperature for crystalline ones, and cooling time for both.
Cavity pressure sensors
Teut points out that plastic pressure is usually highest at the screw tip, lower just past the gate and lower again at the end of the cavity during pack, so a press reading only approximates what the part sees. Shane Vandekerkhof of RJG, interviewed by MoldMaking Technology, puts the sensor where the problem shows, usually the last place to fill, because most quality defects correlate with pressure there: too much and parts grow, too little and they shrink. On a cold-runner mold, one end-of-cavity sensor in the last-filling cavity works up to about eight cavities; hot runners need more because thermal cycling lets the flow pattern drift.
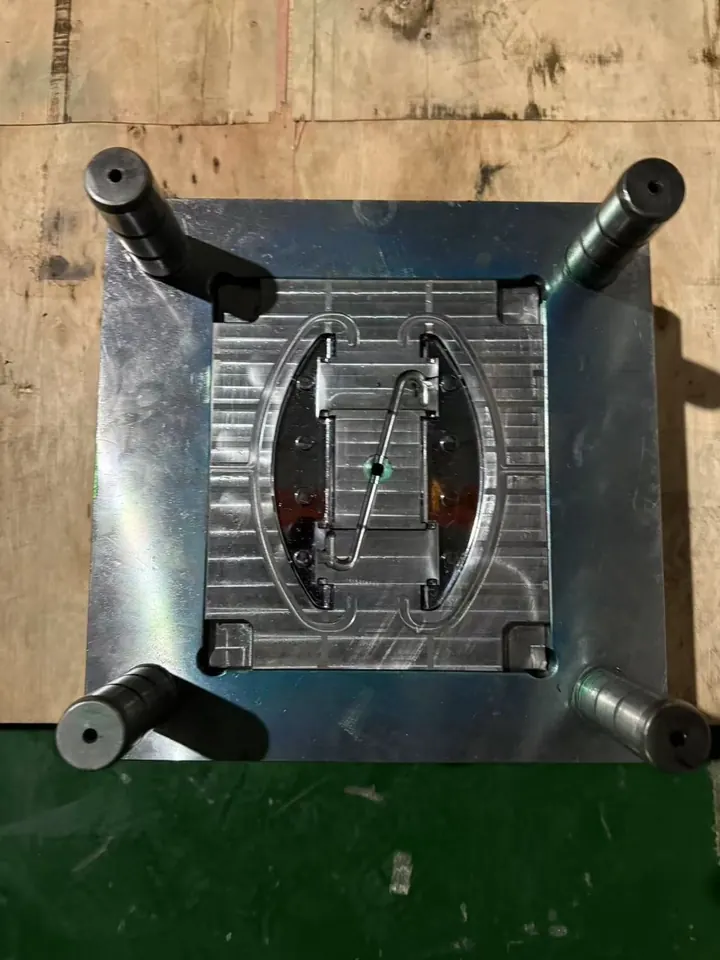
Button-type sensors sit behind an ejector pin, blade or core pin; flush-mount types face the plastic where no pin is available, and all flush-mount sensors are piezoelectric. RJG's selection guide adds that a sensor used to trigger switchover must sit where the press can still drive plastic at transfer. For a buyer, the point is timing: sensor pockets and wiring are part of the mold design, so decide before the tool is quoted.
The process sheet: written from the plastic's side
A setup sheet tells a technician what to dial into one press. A process sheet built this way records what the plastic experienced, so the process can be checked and moved; shop names vary, and you want both layers. Teut is specific that melt temperature means the plastic measured at the nozzle, since a barrel set at 500°F doesn't make the melt 500°F and much of the melt's heat comes from screw shear. Bozzelli is equally specific that matching a process between machines means matching plastic pressures, not hydraulic ones; Beaumont notes no conversion is needed on an electric press.
A credible sheet lists fill time with its band, transfer position with the fill-only weight it gives, peak fill pressure against the press maximum, pack and hold pressures and times, gate-seal time and whether the process runs sealed, measured melt temperature, mold surface temperatures on both halves, coolant flow, cooling time, cushion and screw recovery time, plus resin grade and drying (see drying hygroscopic resins).
What a buyer should ask a molder for
Ask for documents, not adjectives:
| Ask for | A credible version shows | Red flag |
|---|---|---|
| Press baseline | Speed linearity, check-ring and load results for the press quoted, dated | Data from a different press |
| Viscosity curve | Raw fill times and pressures, the conversion, the fill time picked and why | A curve with no data behind it |
| Cavity balance | Fill-only weights per cavity, ideally at two speeds | Balance judged only on packed parts |
| Pressure drop | Loss per segment against the press maximum | Fill pressure at or near the limit |
| Gate seal | Weight vs hold time, chosen hold, sealed or unsealed decision | Hold time copied from another job |
| Cooling | Dimension or warp vs cooling time, surface temperatures, flow | Cooling time set by the quote |
| Window and DOE | Cosmetic window, DOE runs with dimensions, setpoints near the middle | Dimensions met only at one edge |
| Process and setup sheets | Plastic-side values plus press setpoints, revision-controlled | Only barrel temps and hydraulic pressure |
| Capability | Cpk per cavity on critical dimensions from a production-length run, gauge study behind it | One pooled number, or Cpk from five trial parts |
The capability target is yours to set in the purchase documents. The Cpk calculator works out the index from readings, and the gauge R&R calculator checks whether the gauge can see the tolerance. Mark which dimensions are critical on the drawing; see part tolerances.
Where this sits next to mold trials and IQ/OQ/PQ
Mold trials get the tool right: steel, cosmetics, dimensions. Scientific molding is the engineering method that develops the process, mostly during and after those trials. IQ/OQ/PQ validation is the formal, protocol-driven proof that a finished process holds at its limits and repeats. A molder can run every study here without a formal validation, and an OQ is far stronger when it challenges a window that came from these studies. When a tool moves, the plastic-side sheet is what lets a new press reproduce the process; see moving your mold.
Red flags
- "We do scientific molding," a training certificate or a sensor brand offered instead of study data.
- No fill time on the process sheet, or one that changes from run to run.
- A first stage that fills the part completely before transfer. That isn't decoupled.
- Cavity imbalance answered with more pack pressure or clamp instead of a gate or runner fix.
- Setpoints at the edge of the window to hit a dimension that belongs in steel.
- Studies without dates, resin lot or press number.
How far to push depends on the part. A non-critical single-cavity cover may only need a fill time, transfer point, gate-seal time and a plastic-side sheet. A multi-cavity mold with tight fits, or a regulated product, should come with the full set and possibly sensors.
Common questions
Is scientific molding the same thing as decoupled molding?
Nearly. Decoupled molding is the core technique: filling the part under speed control, then packing and holding under pressure as separate stages. Scientific molding is the wider method around it, including the machine checks, the viscosity, balance, pressure-drop, gate-seal and cooling studies, the process window, and a process sheet written in plastic-side values.
How full should the part be when the press switches from fill to pack?
For a Decoupled II process, an RJG trainer writing in Plastics Technology gives at least 95% visually full and no more than 98% full by weight. John Bozzelli runs his viscosity-curve shots about 99% full by volume. Either way the first-stage part is deliberately short, and the transfer position is adjusted until the fill-only part matches the target.
Does scientific molding require cavity pressure sensors?
No. A Decoupled II process transfers on screw position and can be developed and documented without sensors in the mold. Decoupled III, which also separates pack from hold, generally switches on a cavity pressure reading, so it needs sensors plus the equipment and training to use them. Sensors also help monitor production, but their locations must be planned into the mold design.
How is scientific molding different from IQ/OQ/PQ validation?
Scientific molding is how the process is developed: the studies that set fill time, transfer, pack, hold and cooling. IQ/OQ/PQ is a formal, protocol-driven proof that the finished process holds at its limits and repeats in production, usually required for medical parts. The studies feed the validation, especially the operating window that OQ challenges, but one doesn't replace the other.
Is the relative viscosity curve a reliable way to pick fill time?
It's widely taught and a reasonable starting point, but it has critics. John Beaumont, drawing on tests of more than 40 production molds, argued it can't isolate what happens in the cavity and that choosing a point on the curve is largely arbitrary. Ask the molder why the fill time was chosen and what band they hold it to, rather than accepting a graph alone.
Sources
- Plastics Technology - Logan Teut (RJG), Up to Snuff on Scientific Molding? Then It's Time to Mold Systematically (Decoupled II/III, 95%/98% fill, machine baselines, cooling share of cycle)
- Plastics Technology - John Bozzelli, Understanding Polymer Flow: Interpreting the Viscosity Curve (2012)
- Plastics Technology - John Beaumont, A New Look at Evaluating Fill Times for Injection Molding (2013)
- Plastics Technology - John Bozzelli, Understanding Pressure Loss in Injection Molding (2011)
- Plastics Technology - John Bozzelli, Balanced Filling Is Critical for Holding Molding Tolerances (2010)
- Plastics Technology - John Bozzelli, Why Multi-Cavity Molds Fill Unevenly (2011)
- Plastics Technology - John Bozzelli, Why and How to Do Gate-Seal Experiments
- Plastics Technology - Suhas Kulkarni, A Systematic Approach to Process Development (cosmetic and dimensional process windows)
- Plastics Technology - Suhas Kulkarni, Design of Experiments for Injection Molding, Part 1 (DOE factors)
- MoldMaking Technology - Cavity Pressure Selection Options and Solutions (Shane Vandekerkhof, RJG)
- RJG - What Sensor Is Right for My Molding Process? (sensor location and type)
Send the part file and the quantity you expect to run, and we'll review it before you commit to tooling. NDA first if you want one.
Send a part for reviewBook a 30-minute call